
Counting birthdays, center values and complete numerical charts gives three different answers. This experiment groups every valid date from 1900 through 2025 by the three starting anchors A,B,C.
The interval contains 46,021 dates and 5,544 distinct numerical chart signatures. These are calendar calculations, not customer data. The existing twins guide explains what shared charts mean for people; this laboratory explains how to construct and count the groups.
Why three anchors identify the numerical construction
A is the reduced day, B the month and C the reduced year-digit sum. Every other personal numerical position is a deterministic function of these anchors and their descendants. Equal A,B,C therefore produce equal later positions, chakra cells and perimeter values under the same engine.
Conversely, if complete numerical charts agree, their displayed A,B,C agree too. That makes the three-anchor signature sufficient for this counting task. It does not make the dates or account records identical.
| Date | A | B | C | E | Heart |
|---|---|---|---|---|---|
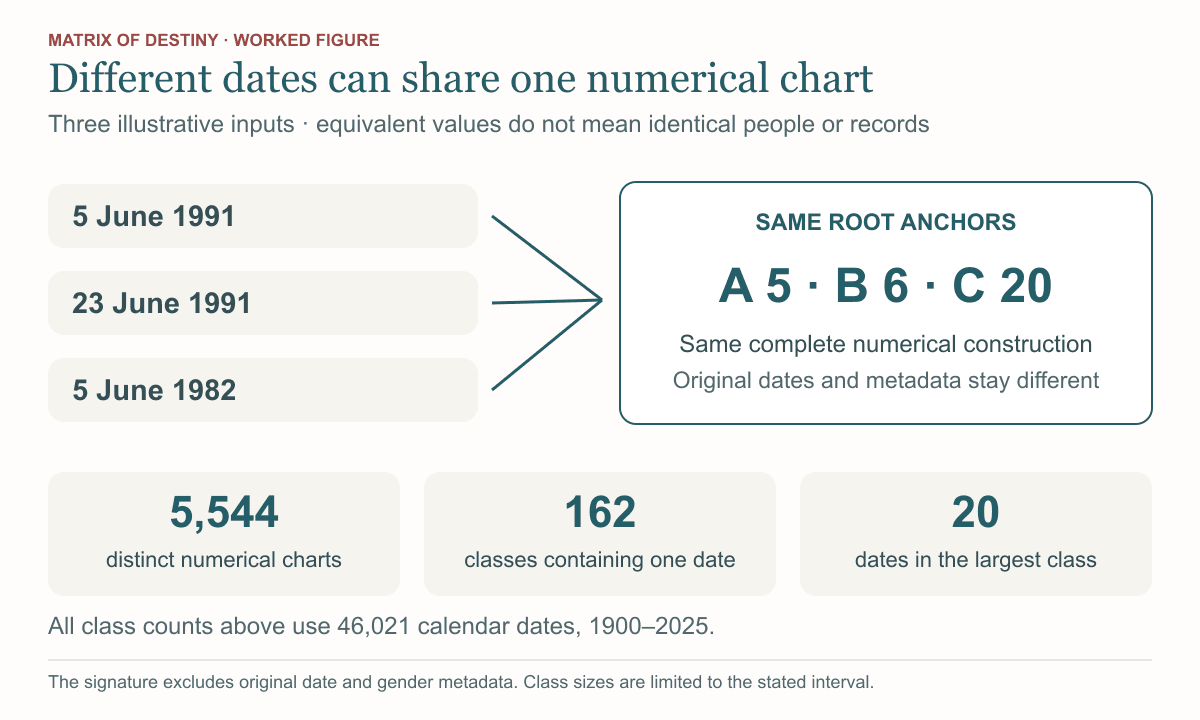
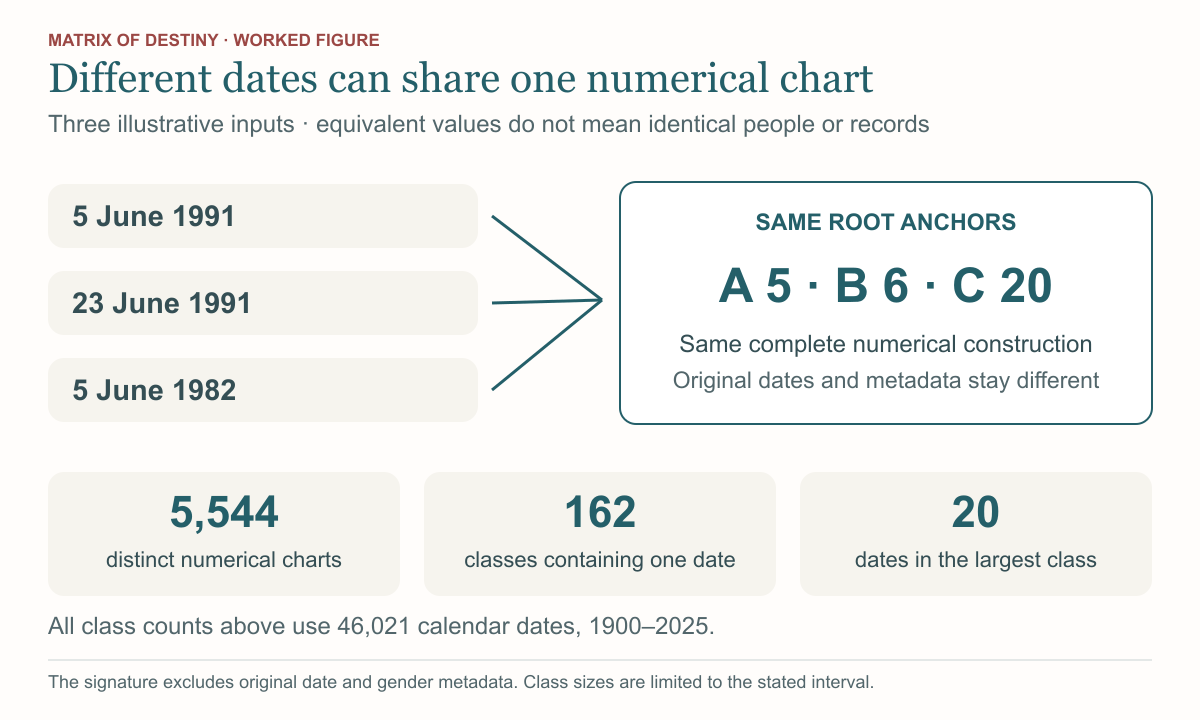
| 5 June 1991 | 5 | 6 | 20 | 8 | 7 |
| 23 June 1991 | 5 | 6 | 20 | 8 | 7 |
| 5 June 1982 | 5 | 6 | 20 | 8 | 7 |
Count signatures rather than center values
Enumerate valid dates, calculate each chart and count the string A/B/C. In the fixed interval, there are 5,544 signatures. Of those groups,162 contain one date; the largest contains 20 dates. Those are class sizes within this interval, not limits over all possible years.
A single center merges many different signatures. Counting centers alone would therefore undercount complete charts. Comparing only text readings would answer another question again, because wording and personal context are separate from the numerical signature.
Keep metadata outside the equality claim
The engine returns the original birth date and gender metadata along with its numerical values. The equivalence claim excludes those metadata fields. Two equal numerical objects can still refer to different entered dates and different saved records.
Likewise, a caption, custom label or interpretation may differ. Equality of the numerical construction does not prove identical experiences, preferences or futures. It also does not prove that a screenshot is anonymous: some classes in this interval contain only one date, and surrounding context can reveal more.
Build and inspect an equivalence class
The first two illustrative dates in the table share a day anchor because 5 stays 5 and 23 reduces to 5. The third keeps day and month while changing 1991 to 1982; both years digit-sum to 20. You can verify equality without inferring anything about imaginary people.
- Define the exact interval and engine convention.
- Enumerate valid dates and calculate A,B,C for each.
- Group by the three-anchor signature.
- Inspect one group and compare every numerical field, not just E.
- Report class counts, metadata exclusions and the limits of the interval.
Extending the interval may enlarge existing classes and introduce signatures not present in a smaller selection. Preserve the scope alongside every published count.
Inspect the complete results and reproduce the experiment
The downloads include every chart-class count, the center totals and grouping totals for the stated scope. The reproduction bundles the same calculation engine used by this site; no private repository access, package installation or account is required.
To reproduce the results, save the .mjs file and run node destiny-matrix-lab-reproduction.mjs with Node 18 or later. It prints the complete result JSON. The version manifest records the source files and SHA-256 file checksums. These resources reproduce arithmetic, not birth frequencies, personality claims or predictions.
Download complete center counts, all 5,544 chart-class counts and grouping results (.json)
Download the complete runnable reproduction, including the calculation engine (.mjs)
Third-party license included with the reproduction (.txt)
Download the method version, source and file SHA-256 checksums (.json)
Chart equivalence experiment
Use the fields below to make your own record. The downloadable text copy is editable and can be used without an account.
- Inclusive calendar interval:
- Signature definition:
- Valid dates counted:
- Distinct signatures:
- One illustrative class:
- Full numerical comparison:
- Metadata excluded from equality:
- Population and privacy limits:
Method, sources, and editorial approach
- Natalia Ladini: publisher author profile and book list (Russian). Reference for the method's author and published works.
- Yuliana Lisovskaya, Matrix of Destiny: Compatibility, chapter two (Russian reading preview). Reference for the core construction and staged reduction used here.
- Matrix of Destiny production calculation engine; fixed illustrative inputs and exhaustive calendar experiment, checked November 5, 2026
This site’s calculation reference documents its numerical construction. Where this guide includes worked Matrix values, they come from the same engine as the full chart. Exercises and reflection questions are original editorial suggestions, not quotations from these sources; their usefulness is not established by the calculations. The method references document a spiritual practice. Listing a source does not establish scientific support for the interpretations or imply endorsement of this website.
This guide was drafted with AI assistance to explain the topic and organize examples. It is published by Matrix of Destiny, owned by Ana Kalender. No independent practitioner review is claimed. See our editorial approach and corrections policy.